Actual patterns
Patterns are graphical models which are formed in the chart by the price. According to one of the technical analysis postulates, history (price movement) repeats itself. It means that the price movements are often similar in the same situations which makes it possible to predict the further development of the situation with a high probability.
Actual Patterns
- All
- Double Top
- Flag
- Head and Shoulders
- Pennant
- Rectangle
- Triangle
- Triple top
- All
- #AAPL
- #AMZN
- #Bitcoin
- #EBAY
- #FB
- #GOOG
- #INTC
- #KO
- #MA
- #MCD
- #MSFT
- #NTDOY
- #PEP
- #TSLA
- #TWTR
- AUDCAD
- AUDCHF
- AUDJPY
- AUDUSD
- EURCAD
- EURCHF
- EURGBP
- EURJPY
- EURNZD
- EURRUB
- EURUSD
- GBPAUD
- GBPCHF
- GBPJPY
- GBPUSD
- GOLD
- NZDCAD
- NZDCHF
- NZDJPY
- NZDUSD
- SILVER
- USDCAD
- USDCHF
- USDJPY
- USDRUB
- All
- M5
- M15
- M30
- H1
- D1
- All
- Buy
- Sale
- All
- 1
- 2
- 3
- 4
- 5
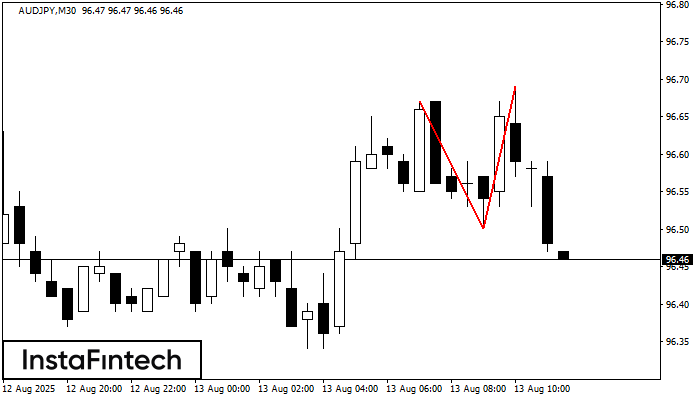
The Double Top pattern has been formed on AUDJPY M30. It signals that the trend has been changed from upwards to downwards. Probably, if the base of the pattern 96.50
Open chart in a new window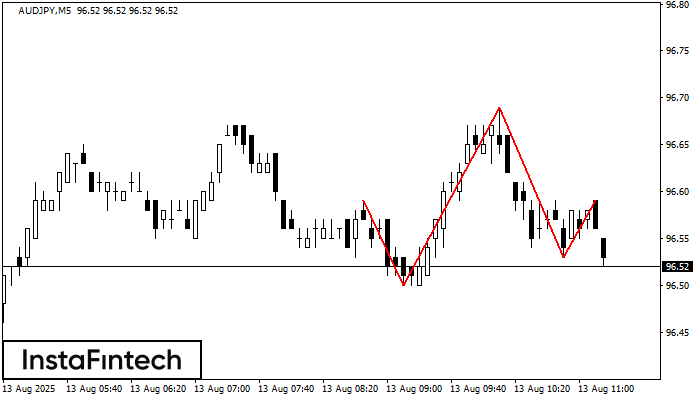
The technical pattern called Head and Shoulders has appeared on the chart of AUDJPY M5. There are weighty reasons to suggest that the price will surpass the Neckline 96.50/96.53 after
The M5 and M15 time frames may have more false entry points.
Open chart in a new window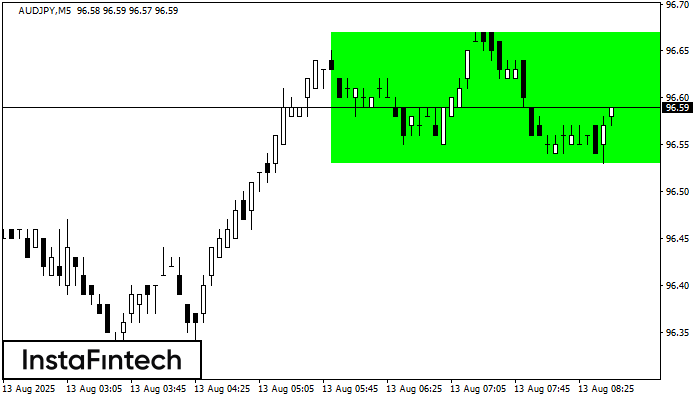
According to the chart of M5, AUDJPY formed the Bullish Rectangle. The pattern indicates a trend continuation. The upper border is 96.67, the lower border is 96.53. The signal means
The M5 and M15 time frames may have more false entry points.
Open chart in a new window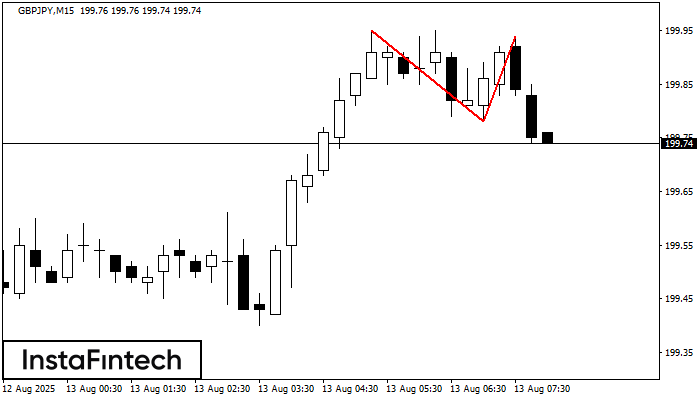
The Double Top reversal pattern has been formed on GBPJPY M15. Characteristics: the upper boundary 199.95; the lower boundary 199.78; the width of the pattern is 16 points. Sell trades
The M5 and M15 time frames may have more false entry points.
Open chart in a new window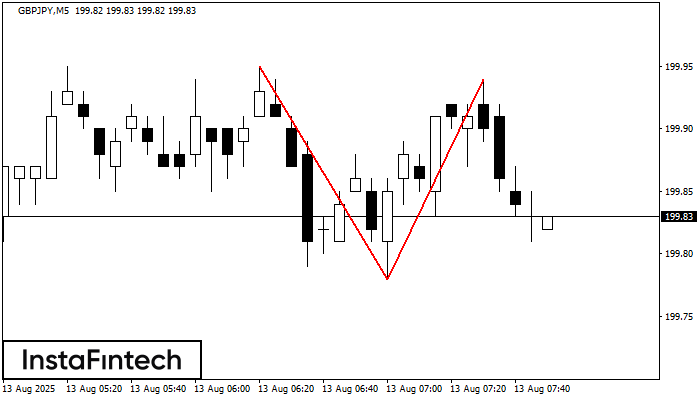
The Double Top pattern has been formed on GBPJPY M5. It signals that the trend has been changed from upwards to downwards. Probably, if the base of the pattern 199.78
The M5 and M15 time frames may have more false entry points.
Open chart in a new window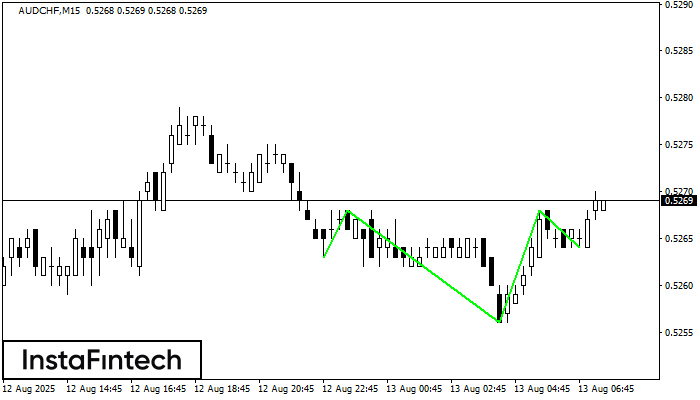
According to M15, AUDCHF is shaping the technical pattern – the Inverse Head and Shoulder. In case the Neckline 0.5268/0.5268 is broken out, the instrument is likely to move toward
The M5 and M15 time frames may have more false entry points.
Open chart in a new window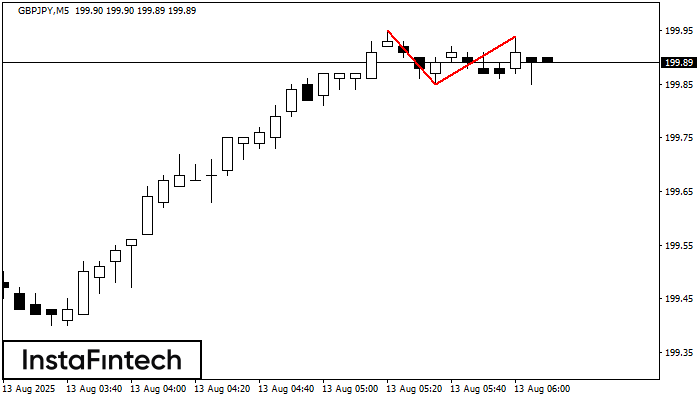
On the chart of GBPJPY M5 the Double Top reversal pattern has been formed. Characteristics: the upper boundary 199.94; the lower boundary 199.85; the width of the pattern 9 points
The M5 and M15 time frames may have more false entry points.
Open chart in a new window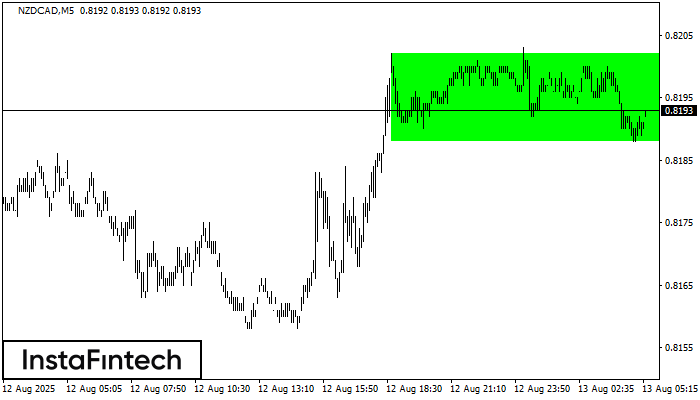
According to the chart of M5, NZDCAD formed the Bullish Rectangle which is a pattern of a trend continuation. The pattern is contained within the following borders: the lower border
The M5 and M15 time frames may have more false entry points.
Open chart in a new window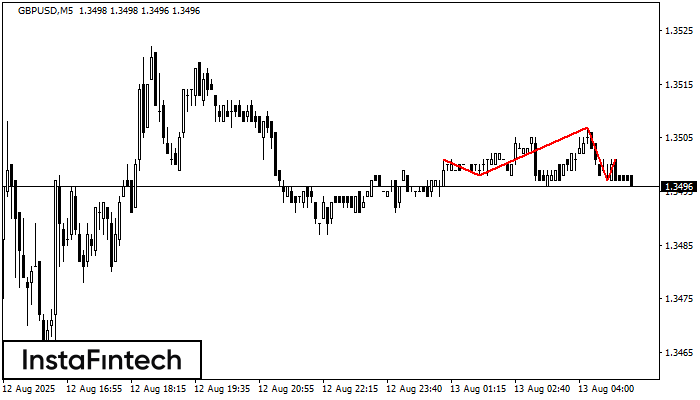
The GBPUSD M5 formed the Head and Shoulders pattern with the following features: The Head’s top is at 1.3507, the Neckline and the upward angle are at 1.3498/1.3497. The formation
The M5 and M15 time frames may have more false entry points.
Open chart in a new window