empty
14.03.2025 03:29 PM
EUR/USD: March 14th. Bears Make Weak Attempts

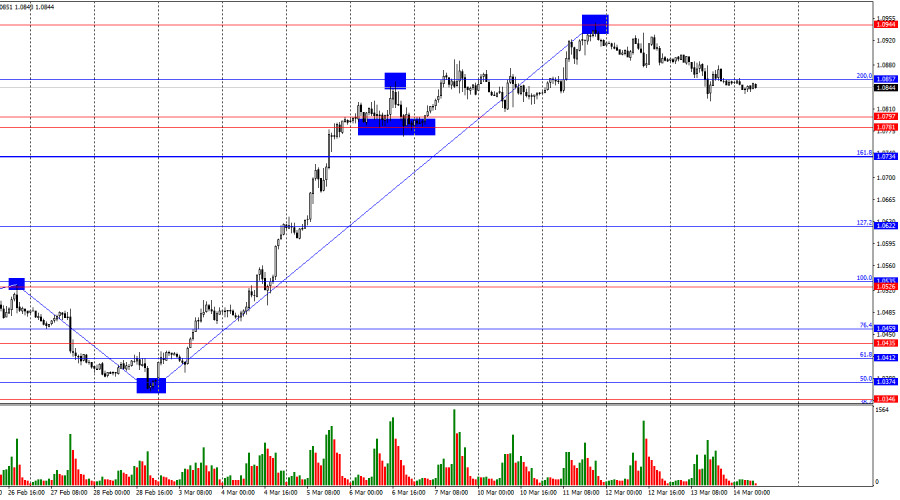
On Thursday, the EUR/USD pair continued its decline and consolidated below the 200.0% corrective level at 1.0857. This suggests that the downward movement could extend toward the next support zone at 1.0781–1.0797, as well as the 161.8% Fibonacci level at 1.0734. A break above 1.0857 would indicate a potential reversal in favor of the euro, leading to a renewed uptrend toward 1.0944.

This image is no longer relevant

The wave structure on the hourly chart has changed. The last completed downward wave broke below the previous low, while the last upward wave broke above the previous peak, indicating that a bullish trend is forming. However, the current impulsive growth is largely driven by concerns over a U.S. economic slowdown due to Donald Trump's policy measures. This appears to be the primary reason for the recent weakness of the U.S. dollar.

Thursday's fundamental background was mixed, as was traders' reaction. The market is currently paying little attention to economic data, focusing instead on the broader outlook for the U.S. and global economy. While a rise in Eurozone industrial production is a positive factor, it is not enough to sustain further euro growth at this time. Similarly, a decline in the U.S. Producer Price Index (PPI) is also favorable, but the dollar requires stronger, more significant economic data to regain momentum.

The key market driver remains U.S. President Donald Trump, who yesterday suggested the possibility of taking Greenland by military force. He also claimed that the entire world is exploiting America and that it is time to change that. As a result, we can expect many major geopolitical events in the near future—but unlike economic reports, these developments do not appear on the calendar. News could emerge unexpectedly, and traders' reactions may be just as unpredictable.

This image is no longer relevant

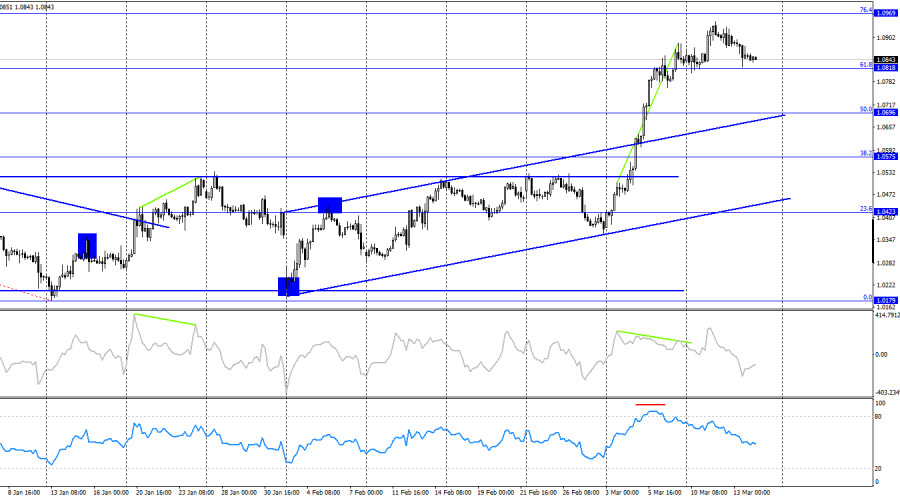
On the four-hour chart, the bullish trend continues, with the pair maintaining an uptrend after breaking out of a horizontal channel. The ascending trend corridor confirms this bullish sentiment. A break above the 61.8% Fibonacci level at 1.0818 could lead to further gains toward the 76.4% Fibonacci level at 1.0969.

At the same time, a bearish divergence on the CCI indicator and overbought conditions on the RSI signal that the pair may be ready for a correction, though bears have been attacking very weakly. A break below 1.0818 would indicate a possible decline toward 1.0696.

Commitments of Traders (COT) Report:

This image is no longer relevant

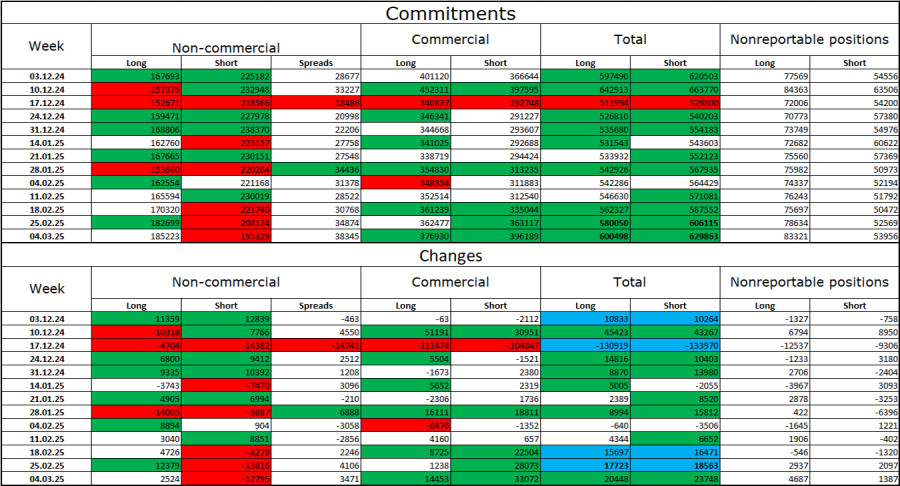
During the latest reporting week, professional traders opened 2,524 long positions and closed 12,795 short positions. The sentiment among Non-commercial traders remains bearish, but it has been weakening recently.

The total number of long positions among speculators now stands at 185,000, while short positions amount to 195,000.

For twenty consecutive weeks, large investors were selling the euro, confirming a bearish trend with no signs of reversal. The divergence in monetary policy between the ECB and the Federal Reserve still favors the U.S. dollar, as the interest rate differential remains in the dollar's favor. While the bearish advantage is starting to erode, it is too early to declare the downtrend over.

Interestingly, the number of long positions has been increasing for five consecutive weeks, coinciding with Donald Trump's presidency—a development worth noting.

Economic Calendar for the U.S. and Eurozone:

  • Eurozone – Germany Consumer Price Index (07:00 UTC)
  • U.S. – University of Michigan Consumer Sentiment Index (14:00 UTC)

On March 14, the economic calendar includes two events, but both are low-impact. The overall market sentiment on Friday is likely to be minimally influenced by fundamental data.

EUR/USD Forecast and Trading Recommendations:

Selling the pair is possible if EUR/USD consolidates below 1.0857 on the hourly chart, with targets at 1.0797 and 1.0734.

Buying opportunities exist, but the strong and uninterrupted rally remains concerning. I remain cautious about such one-sided movements, as they often signal potential market reversals or corrections.

Fibonacci levels are drawn from 1.0529–1.0213 on the hourly chart and from 1.1214–1.0179 on the four-hour chart.

Samir Klishi,
ইন্সটাফরেক্সের বিশ্লেষণ বিশেষজ্ঞ
© 2007-2025
Summary
Urgency
Analytic
Grigory Sokolov
Start trade
ইনস্টাফরেক্স দিয়ে ক্রিপ্টোমুদ্রা দর পরিবর্তনে আয় করুন।
মেটাট্রেডার 4 ডাউনলোড করে আপনার প্রথম ট্রেড চালু করুন।
  • চ্যান্সি ডিপোজিট
    আপনার অ্যাকাউন্টে $3,000 জমা করুন এবং $4000 এর অধিক নিন!
    চ্যান্সি ডিপোজিট প্রচারাভিযানে আমরা জুলাই $4000 লটারি করেছি! একটি ট্রেডিং অ্যাকাউন্টে $3,000 জমা করে এই অর্থ জেতার একটি সুযোগ নিন! এই শর্ত পূরণ করে, আপনি একজন অংশগ্রহণকারী হতে পারবেন।
    প্রতিযোগীতায় অংশগ্রহণ করুন

সুপারিশকৃত নিবন্ধ

USD/CAD. বিশ্লেষণ ও পূর্বাভাস

USD/CAD পেয়ার বর্তমানে একটি বিয়ারিশ কনসলিডেশনের মধ্যে রয়েছে, যেখানে মূল্য 1.3600-এর সাইকোলজিক্যাল লেভেলের নিচে সংকীর্ণ রেঞ্জে ওঠানামা করছে। টেকনিক্যাল দৃষ্টিকোণ থেকে , এই পেয়ারের মূল্য 1.3635-এর হরাইজন্টাল সাপোর্ট লেভেল ব্রেক

Irina Yanina 12:09 2025-07-23 UTC+2

বিটকয়েন ট্রেডিং সিগন্যাল, ২৩–২৬ জুলাই, ২০২৫: বিটকয়েনের মূল্য $118,000 (21 SMA - 6/8 মারে)-এর ওপরে থাকলে এটি ক্রয় করুন

বিটকয়েন বর্তমানে প্রায় $118,000-এর আশেপাশে ট্রেড করছে, এটির মূল্য $120,000-এর সাইকোলজিক্যাল লেভেলে পৌঁছানোর পর একটি টেকনিক্যাল কারেকশনের শুরু হয়েছে। এই এরিয়াটি একটি শক্তিশালী রেজিস্ট্যান্স হিসেবে কাজ করছে। যেহেতু বিটকয়েনের মূল্য

Dimitrios Zappas 08:58 2025-07-23 UTC+2

স্বর্ণের (XAU/USD) ট্রেডিং সিগন্যাল, ২৩–২৬ জুলাই, ২০২৫: স্বর্ণের মূল্য $3,437 (21 SMA - 8/8 মারে)-এর নিচে থাকা অবস্থায় এটি বিক্রি করুন

তবে যদি স্বর্ণের মূল্য 3,437-এর ওপরে কনসোলিডেট করে, তাহলে স্বর্ণের মূল্যের বুলিশ প্রবণতার সম্ভাবনা তৈরি হবে। এ অবস্থায়, মূল্য প্রথমে +1/8 মারে (3,472)-তে পৌঁছাতে পারে এবং এমনকি $3,500-এর সাইকোলজিক্যাল রেজিস্ট্যান্স

Dimitrios Zappas 08:52 2025-07-23 UTC+2

স্বর্ণের (XAU/USD) ট্রেডিং সিগন্যাল, ২২-২৫ জুলাই, ২০২৫: স্বর্ণের মূল্য $3,380 এর উপরে থাকা অবস্থায় কিনুন এবং $3,370 এর (200 EMA - 7/8 মারে) নিচে থাকা অবস্থায় বিক্রি করুন

ঈগল ইন্ডিকেটর ওভারবট জোনে পৌঁছেছে, তাই আমরা মনে করি স্বর্ণের মূল্য আসন্ন দিনগুলোতে একটি শক্তিশালী টেকনিক্যাল কারেকশনের মধ্য দিয়ে যেতে পারে। বিশেষ করে যদি মূল্য 6/8 মাড়ে লেভেলের নিচে নেমে

Dimitrios Zappas 08:35 2025-07-22 UTC+2

বিটকয়েনের ট্রেডিং সিগন্যাল, ২২-২৫ জুলাই, ২০২৫: মূল্য $115,625-এর (/8 মারে - 21 SMA) এর উপরে থাকা অবস্থায় বিটকয়েন কিনুন

বিটকয়েন বর্তমানে প্রায় $117,522 এর আশেপাশে ট্রেড করছে, এটির মূল্য $116,070 এর নিচে থেকে পুনরুদ্ধার করেছে। গতকাল ইউরোপীয় সেশনে বিটকয়েনের মূল্য $119,500-এর উচ্চতায় পৌঁছেছিল, তবে $120,000 এর সাইকোলজিক্যাল লেভেলের উপরে

Dimitrios Zappas 08:19 2025-07-22 UTC+2

বিটকয়েনের ট্রেডিং সিগন্যাল, ১৮-২১ জুলাই, ২০২৫: মূল্য $118,000 (6/8 মারে - 21 SMA) এর উপরে থাকা অবস্থায় বিটকয়েন ক্রয় করুন

যদি 118,750-এর সাপোর্ট বা 118,200 এর কাছাকাছি সেকেন্ডারি আপট্রেন্ড চ্যানেলের দিকে বিটকয়েনের মূল্যের টেকনিক্যাল কারেকশন হয়, তাহলে এটিকে বিটকয়েন ক্রয়ের সুযোগ হিসেবে বিবেচনা করা হবে, যেখানে এটির মূল্যের $121,500-এর দিকে

Dimitrios Zappas 09:45 2025-07-18 UTC+2

স্বর্ণের (XAU/USD) ট্রেডিং সিগন্যাল, ১৮-২১ জুলাই, ২০২৫: মূল্য $3,330 (21 SMA - 5/8 মারে) এর উপরে থাকা অবস্থায় স্বর্ণ ক্রয় করুন

অন্যদিকে, যদি স্বর্ণের মূল্য 3,320-এর নিচে নেমে যায় এবং আপট্রেন্ড চ্যানেল ব্রেক করে নিম্নমুখী হয়, তাহলে আমরা একটি ট্রেন্ড রিভার্সালের প্রত্যাশা করতে পারি এবং তখন এটির মূল্য 4/8 মারে লাইনে

Dimitrios Zappas 08:28 2025-07-18 UTC+2

স্বর্ণের (XAU/USD) ট্রেডিং সিগন্যাল (১৭-২১ জুলাই, ২০২৫): মূল্য $3,329 (200 EMA - 5/8 মারে) এর উপরে থাকা অবস্থায় স্বর্ণ ক্রয় করা যেতে পারে

স্বর্ণ বর্তমানে 3,335 এর আশেপাশে ট্রেড করছে, যেখানে 3,320 এর সর্বনিম্ন এবং গতকাল মার্কিন সেশনে 3,377 এর সর্বোচ্চ লেভেল থেকে রিবাউন্ড করছে। মার্কিন প্রেসিডেন্ট ডোনাল্ড ট্রাম্প পাওয়েলকে বরখাস্ত করার ইঙ্গিত

Dimitrios Zappas 08:28 2025-07-17 UTC+2

বিটকয়েনের ট্রেডিং সিগন্যাল, ১৭-২১ জুলাই, ২০২৫: মূল্য 118,750-এর উপরে (200 EMA - 6/8 মারে) থাকা অবস্থায় বিটকয়েন ক্রয় করা যেতে পারে

যদি বিটকয়েনের মূল্য $115.625-এর (5/8 মারে লেভেল) নিচে নামে, যা ১৪ জুলাইয়ের সর্বনিম্ন লেভেল ছিল, তাহলে এটির মূল্য 200 EMA-এর দিকে যেতে পারে, যা $110,000-এর সাইকোলজিক্যাল লেভেলের কাছাকাছি অবস্থান করছে।

Dimitrios Zappas 08:19 2025-07-17 UTC+2

স্বর্ণের (XAU/USD) ট্রেডিং সিগন্যাল, ১৭–২০, ২০২৫ জুলাই: মূল্য $3,300 (21 SMA - 5/8 মারে) এর উপরে থাকা অবস্থায় স্বর্ণ ক্রয় করুন

ঈগল ইন্ডিকেটর একটি পজিটিভ সিগন্যাল দেখাচ্ছে। তবে, স্বর্ণের মূল্যের বিয়ারিশ চাপও বিদ্যমান, তাই আমাদের সতর্ক থাকতে হবে, কারণ আগামী দিনগুলোতে স্বর্ণের দরপতন অব্যাহত থাকতে পারে। টেকনিক্যাল রিবাউন্ডের সম্ভাবনাও রয়েছে, কারণ

Dimitrios Zappas 08:47 2025-07-16 UTC+2
এখন কথা বলতে পারবেন না?
আপনার প্রশ্ন জিজ্ঞাসা করুন চ্যাট.
Widget callback
 

Dear visitor,

Your IP address shows that you are currently located in the USA. If you are a resident of the United States, you are prohibited from using the services of InstaFintech Group including online trading, online transfers, deposit/withdrawal of funds, etc.

If you think you are seeing this message by mistake and your location is not the US, kindly proceed to the website. Otherwise, you must leave the website in order to comply with government restrictions.

Why does your IP address show your location as the USA?

  • - you are using a VPN provided by a hosting company based in the United States;
  • - your IP does not have proper WHOIS records;
  • - an error occurred in the WHOIS geolocation database.

Please confirm whether you are a US resident or not by clicking the relevant button below. If you choose the wrong option, being a US resident, you will not be able to open an account with InstaForex anyway.

We are sorry for any inconvenience caused by this message.